Overview
Prospera is a bot designed to make Forex trading smarter and simpler. It automates key trading decisions like identifying support and resistance levels and uses Fibonacci retracements to refine entries and exits. Built with MQL5 and Python, Prospera avoids the common pitfalls of manual trading, such as emotional bias and inconsistency. By integrating dynamic risk management and machine learning, it adapts to changing market conditions and improves decision-making.
Technologies and Tools
• Languages: MQL5, Python (Pandas, NumPy, Scikit-learn, TensorFlow)
• Development Environments: MetaTrader 5, Jupyter Notebook
• Machine Learning: Bayesian Optimization, Reinforcement Learning (future feature)
• Data Visualization: Matplotlib
• Version Control: Git
The Journey
Problem: The Challenges of Manual Trading
Manual trading can be overwhelming. Decisions are often influenced by emotions like fear or greed, leading to inconsistency. Traders also face challenges like analyzing large amounts of data in real-time, sticking to their strategies during volatile markets, and managing risks effectively.
As a trader, I noticed these issues in my own trading. I wanted a solution that could make decisions objectively, based on real-time data, and stick to a strategy no matter what the market conditions were.
As a trader, I noticed these issues in my own trading. I wanted a solution that could make decisions objectively, based on real-time data, and stick to a strategy no matter what the market conditions were.
Solution: Automating Forex Trading
I created Prospera to solve these problems. It’s a trading bot that:
1. Eliminates Emotional Bias:
• Prospera follows a predefined strategy based on price action, so emotions don’t affect its decisions.
• Prospera follows a predefined strategy based on price action, so emotions don’t affect its decisions.
2. Adapts to Markets:
• It uses machine learning to adjust parameters like the lookback period and refine key calculations dynamically.
• It uses machine learning to adjust parameters like the lookback period and refine key calculations dynamically.
3. Simplifies Risk Management:
• Dynamic position sizing and trailing stops keep risk under control, even in volatile markets.
• Dynamic position sizing and trailing stops keep risk under control, even in volatile markets.
The Learning Phase
January 2020 – December 2023
Foundation in Financial Markets
• I started by understanding Forex markets, focusing on price action and market structure.
• Next, I learned programming languages like Python and MQL5, which allowed me to automate strategies and analyze large datasets.
• By 2023, I had a solid foundation in trading and programming, ready to build Prospera.
• Next, I learned programming languages like Python and MQL5, which allowed me to automate strategies and analyze large datasets.
• By 2023, I had a solid foundation in trading and programming, ready to build Prospera.
The Building Phase
February 2024
Ideation and Planning
• The core idea behind Prospera was to trade based on price action, avoiding lagging indicators like moving averages.
March 2024 – June 2024
Development of Core Functions
Fibonacci, Support, and Resistance Functions
• Developed functions to calculate support and resistance levels using fractals.
• Incorporated Fibonacci retracement levels to determine precise entry points.
• Developed functions to calculate support and resistance levels using fractals.
• Incorporated Fibonacci retracement levels to determine precise entry points.
Refinement of Calculations
• Improved the accuracy of support and resistance calculations through iterative testing.
• Improved the accuracy of support and resistance calculations through iterative testing.
Dynamic Lookback Period Challenges
• Attempted to implement a dynamic lookback period; failed then defaulted to a hard-coded 20-candle lookback due to complexity.
• Attempted to implement a dynamic lookback period; failed then defaulted to a hard-coded 20-candle lookback due to complexity.
Spike Detection
• Identified that price spikes were causing noise and false entries.
• Created a function to detect and filter out spikes from the data.
• Identified that price spikes were causing noise and false entries.
• Created a function to detect and filter out spikes from the data.
Spread Management
• Noticed trades were opening when spreads were too high, leading to losses.
• Implemented a function to execute trades only when the spread is less than or equal to 1.0 pip.
• Noticed trades were opening when spreads were too high, leading to losses.
• Implemented a function to execute trades only when the spread is less than or equal to 1.0 pip.
Trade Execution Control
• Addressed the issue of multiple simultaneous trades by limiting open positions to one at a time.
• Addressed the issue of multiple simultaneous trades by limiting open positions to one at a time.
Trade Frequency Regulation
• Introduced a cooldown period between trades to prevent overtrading and reduce transaction costs.
• Introduced a cooldown period between trades to prevent overtrading and reduce transaction costs.
July 2024 – August 2024
Risk Management Enhancements
Static Risk Parameters
• Implemented functions for static take profit, stop loss, and lot size settings.
• Implemented functions for static take profit, stop loss, and lot size settings.
Trailing Stops Development
• Found that static take profit and stop loss led to missed opportunities.
• Developed and refined trailing stop functions to lock in profits and minimize losses.
• Found that static take profit and stop loss led to missed opportunities.
• Developed and refined trailing stop functions to lock in profits and minimize losses.
Dynamic Lot Sizing
• Created a function for dynamic lot sizing based on account balance to enable profit compounding.
• Created a function for dynamic lot sizing based on account balance to enable profit compounding.
Signal-Based Position Management
• Noticed that new signals were not triggering trades due to position limits.
• Developed a function to close existing positions when an opposite signal is generated, allowing the bot to adapt to market changes.
• Noticed that new signals were not triggering trades due to position limits.
• Developed a function to close existing positions when an opposite signal is generated, allowing the bot to adapt to market changes.
September 2024 – November 2024
Model Creation and Integration
Data Collection and Preparation
• Collected OHLC (Open, High, Low, Close) data across multiple timeframes (1D, 4H, 1H, 15M, 5M) dating back to 1990.
• Cleaned and normalized data, handling missing values and removing anomalies.
• Decided to drop the volume column as it was not necessary for the analysis.
• Collected OHLC (Open, High, Low, Close) data across multiple timeframes (1D, 4H, 1H, 15M, 5M) dating back to 1990.
• Cleaned and normalized data, handling missing values and removing anomalies.
• Decided to drop the volume column as it was not necessary for the analysis.
Feature Engineering
• Engineered features such as trend indicators, support and resistance levels, Fibonacci retracements, and candlestick patterns.
• Generated target variables (Buy, Sell, Hold) for model training.
• Engineered features such as trend indicators, support and resistance levels, Fibonacci retracements, and candlestick patterns.
• Generated target variables (Buy, Sell, Hold) for model training.
Initial Model Training
• Trained preliminary models to determine the best lookback period per timeframe.
• Updated code to implement successful dynamic lookback periods using loops for flexibility.
• Trained preliminary models to determine the best lookback period per timeframe.
• Updated code to implement successful dynamic lookback periods using loops for flexibility.
Exploration of Prophet Library
• Discovered Facebook's Prophet library for time series forecasting.
• Began studying how to integrate Prophet to enhance trend analysis and refine support and resistance calculations.
• Discovered Facebook's Prophet library for time series forecasting.
• Began studying how to integrate Prophet to enhance trend analysis and refine support and resistance calculations.
Results and Impact
Performance Metrics
Profitability
Backtesting showed consistent gains across multiple market conditions.
Accuracy
Over 70% of trades were profitable, with losses kept minimal due to dynamic risk management.
Efficiency
The bot’s calculations are optimized for speed, allowing it to react quickly to real-time data.
Key Achievements
1. Automated trading decisions with consistent results.
2. Improved risk management through dynamic lot sizing and trailing stops.
3. Adapted to changing market conditions using machine learning.
2. Improved risk management through dynamic lot sizing and trailing stops.
3. Adapted to changing market conditions using machine learning.
Risk Management
Trailing Stops
Initially, I used a fixed stop loss and take profit, but this lacked flexibility and didn't account for market volatility. During a discussion about profit-taking challenges, I realized that implementing a trailing stop mechanism would improve the strategy. The trailing stop adjusts the stop loss as the trade moves in our favor, securing profits dynamically.
Algorithm Development
After several iterations and testing on multiple currency pairs and timeframes, I ended up with two static codes developed:
1. Prospera_EURUSD
2. Prospera_AU_EG_EU
Differences in the Implementation of the two Codes
• Prospera_EURUSD: Designed for EURUSD, uses a multi-timeframe approach with Daily (D1) and Hourly (H1) timeframes.
• Prospera_AU_EG_EU: Tailored for AUDUSD and EURGBP, operates on the current chart timeframe.
Currently, the static codes have about 70% profit accuracy. Backtests on AUDUSD from January 2021 to October 2024 showed a profit factor of 1.43 and a recovery factor of 2.33; while the profit factor isn’t exactly the best, the recovery factor was excellent.
Model Training
After tuning, the models were trained on the different timeframes (1D, 4H, 1H, 15M, 5M). The models were evaluated using metrics like MAPE (Mean Absolute Percentage Error).
• 1D Timeframe: Final Model - MAPE: 8.19%
• 4H Timeframe: Final Model - MAPE: 11.76%
• 1H Timeframe: Final Model - MAPE: 1.38%
• 15M Timeframe: Final Model - MAPE: 9.22%
• 5M Timeframe: Final Model - MAPE: 10.07%
1H timeframe produced the best model with a MAPE of 1.38%. The model also predicted the best lookback periods for each timeframe, which I implemented in the two static codes I wrote.
Visualization
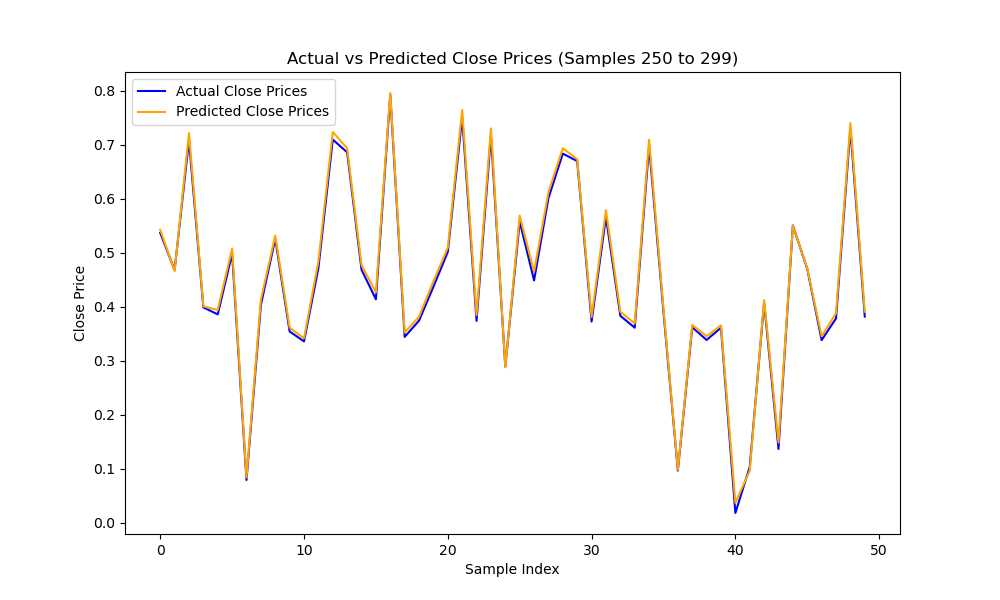
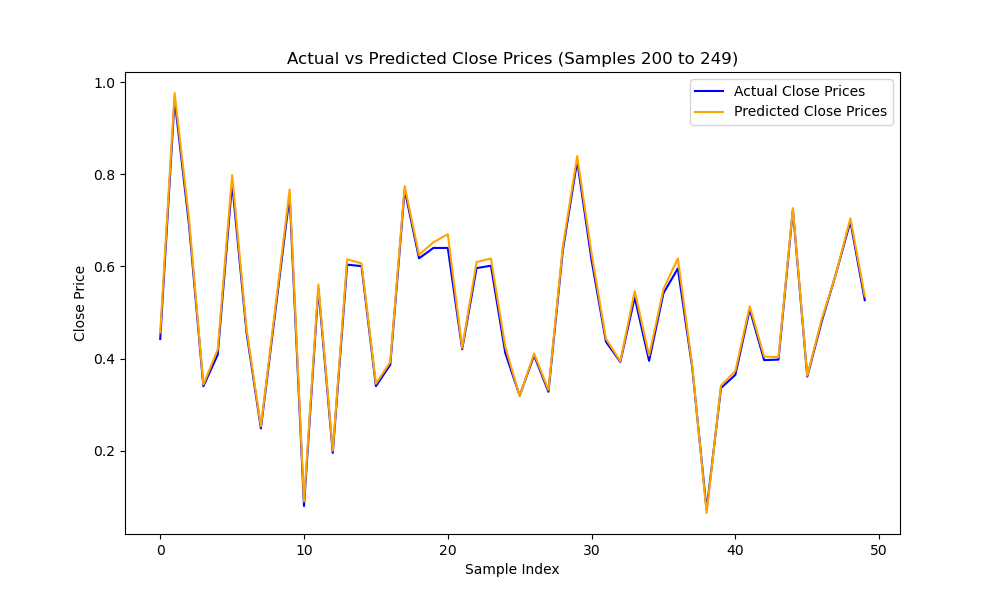
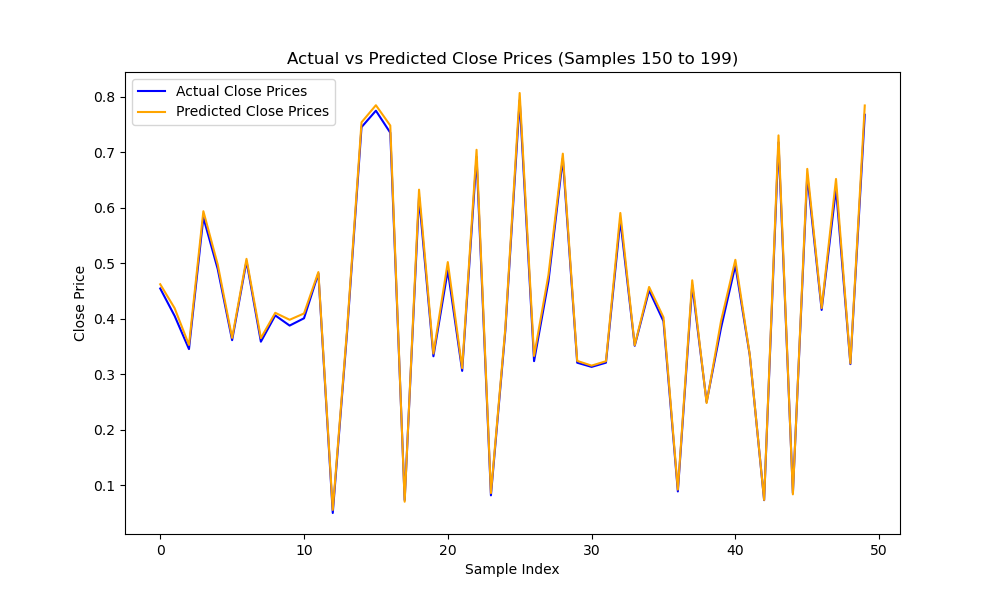
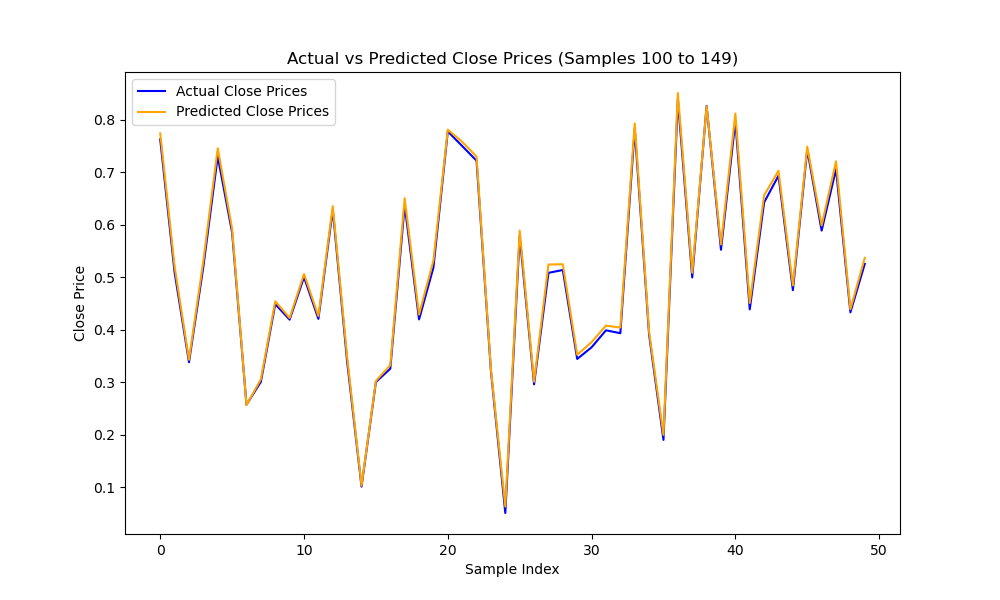
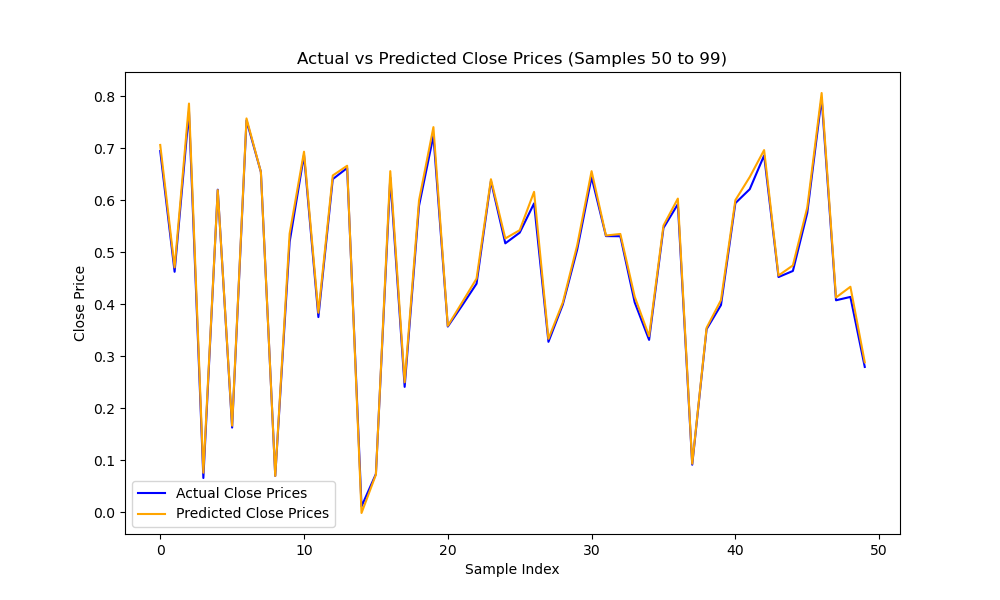
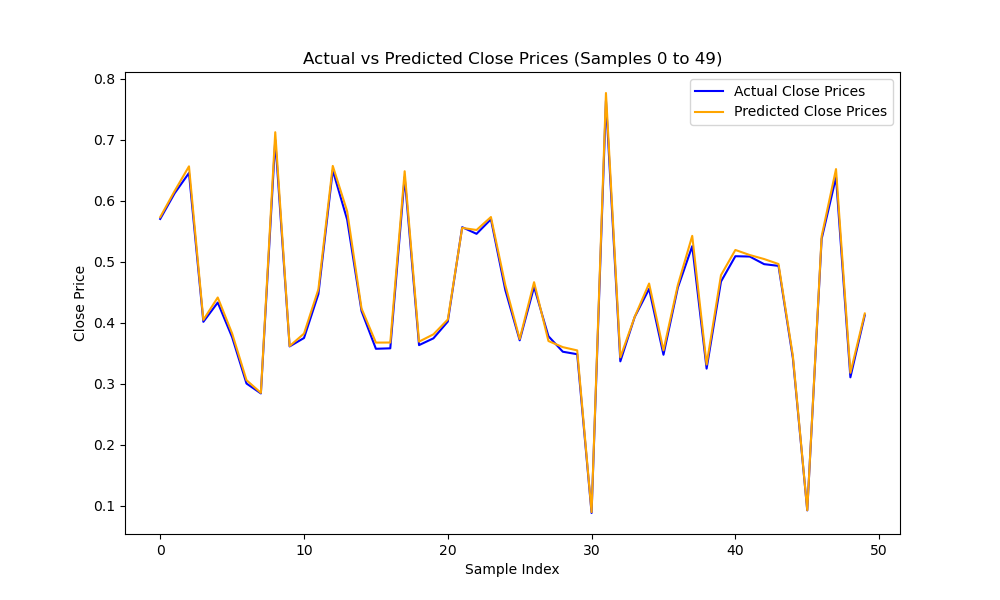
I used Matplotlib to visualize the model’s predictions versus actual values for each timeframe by generating graphs that compare actual closing prices with predicted values across each timeframe.
Here are a few examples comparing the bot’s predicted prices to actual prices, showing how well the model performs across different timeframes:
Here are a few examples comparing the bot’s predicted prices to actual prices, showing how well the model performs across different timeframes:
Backtesting
I tested the bot in a live demo environment, and it followed the strategy rules while adapting to real-time market conditions.
With a capital of $5,000, Prospera_EURUSD generated a total net profit of $34,656.04, with a profit factor of 1.48 on EURUSD.
Prospera_AU_EG_EU produced $63,744.75 net profit with a profit factor of 1.43 on AUDUSD and $21,882.49 net profit with a profit factor of 1.13 on EURGBP.
All of these between January 1, 2021, and October 20, 2024.
Conclusion
Prospera is more than just a trading bot; it’s a step toward smarter, more efficient Forex trading. By automating decisions and integrating machine learning, it removes the emotional and analytical burdens from trading. This project highlights my skills in data analysis, programming, and problem-solving, making it relevant for roles in data science and quantitative trading.
